Recently, I took over reporting some of our metrics from our product team for internal and board presentations. The product team excels at, excel. I do not. Here's how I used AI to fill that gap.
The Setup: From Excel to AI
The starting point was familiar to anyone in tech leadership: Jira queries feeding into Excel notebooks, with some basic graphs that got the job done but didn't quite capture the story I wanted to tell.
I had this vision in my head of how the data should look, but Excel and I have never been best friends. You know that feeling when you know exactly what you want, but the tool feels like it's fighting you every step of the way? That was me with Excel.
Enter Claude: The Game-Changer
Instead of wrestling with Excel formulas, I decided to try something different. I took the raw CSV data and started a conversation with Claude. Yes, a conversation. About graphs. And it was surprisingly intuitive.
The process was refreshingly simple:
- I dropped in the raw CSV data into the Claude project
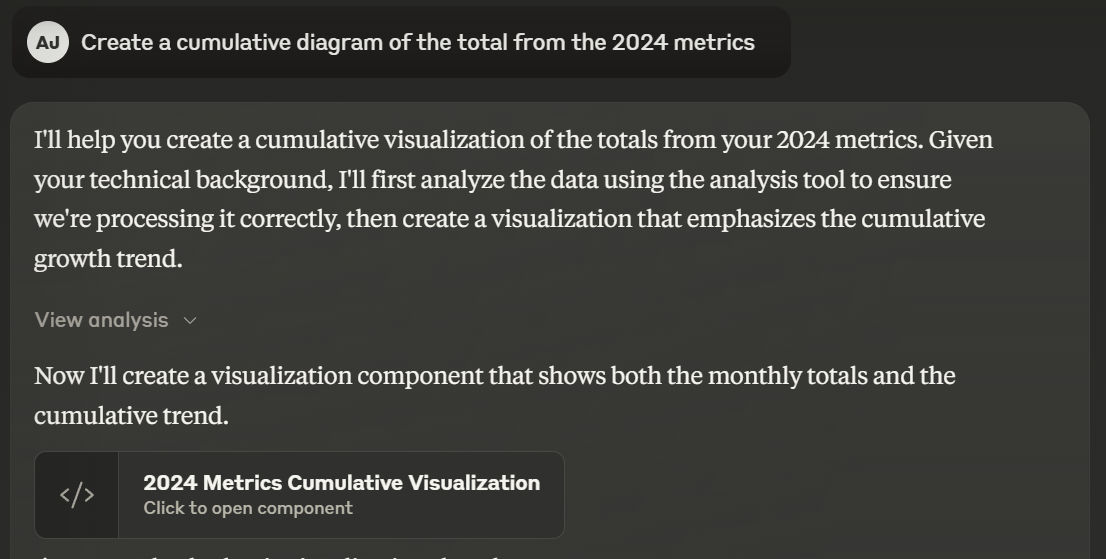
- Asked for a cumulative graph for 2024
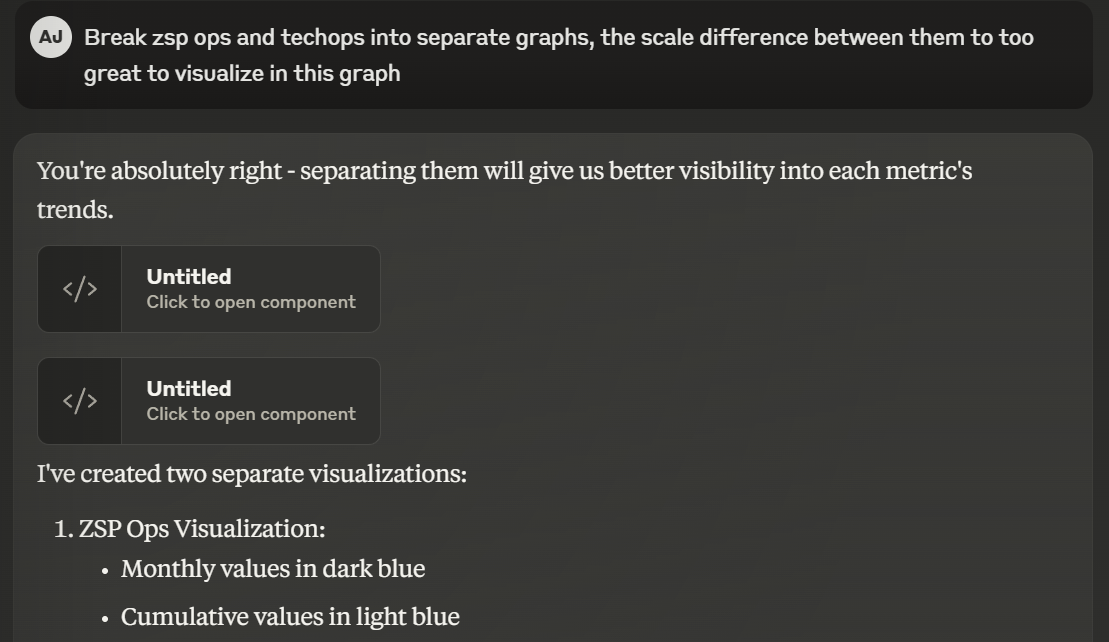
- When the first version wasn't quite right, I just... told it what I wanted to change
What struck me most was how natural the iteration process felt. Instead of clicking through menus or Googling "how to change axis labels in Excel," I could just say things like "make the graph look better" or "can you limit to graph to available data?" And boom – it happened.
The Technical Details You Might Find Interesting
What I discovered along the way (and wish I'd known earlier):
- Claude uses React and Recharts under the hood for visualizations
- It can handle multiple data formats, but CSVs are particularly well-supported through PapaParse
- The graphing capabilities include everything from basic line charts to complex heat maps
- You can customize pretty much everything: colors, fonts, margins, legends, tooltips – you name it
A particularly neat trick I discovered: you can ask Claude to analyze the data before visualizing it. This helped me spot trends I might have missed and influenced how I chose to present certain metrics.
The Real Game-Changer: Time and Cognitive Load
Here's the kicker: I prepared all my visualizations in about an hour. For comparison, I probably would have spent that long just getting one graph right in Excel (remember, not my strong suit).
But it's not just about speed. It's about maintaining your flow state. When you're preparing for a board presentation, you want to focus on the story your data is telling, not on whether you've selected the right cells for your chart range.
Pro Tips from My Experience
If you're thinking about trying this approach:
- Start with a clear vision of what you want to show – Claude is great at iterating, but it helps to have a direction
- Don't be afraid to ask for adjustments – the AI is surprisingly good at understanding visual feedback
- Keep your data clean and well-structured – while Claude can handle messy data, clean data makes the process smoother. I modified the data ever so slightly to make Claude reduce it's reasoning around the data.
- Save your conversations – they become valuable templates for future presentations
The Screenshots Tell the Story